The Project Dashboard page shows the 8 fixed graphs of the selected project, the Cumulative S Curve with Risk Events, Cumulative S Curve Without Risk Events, Delta of Cumulatives, Cost Values with Risk Events Isolated To P, Cost Percentages with Risk Events Isolated To P, Cost Values without Risk Events Isolated To P, Cost Percentages without Risk Events Isolated To P and Total Status. The Dashboard page is visible to only those users with Read/Write or View access.
To get individual task´s Cumulative S Curve, Cumulative S Curve without Risks and Delta of Cumulatives reports, select the particular task from the PROJECT REPORT dropdown.

Figure 1
Run Analysis:
This functionality is used to generate Cumulative S Curve chart based on the number of iteration.
Steps:
- Cost Analysis —> Dashboard
- Click RUN ANALYSIS icon to generate the task simulation reports. (Figure 2)

Figure 2
Check All:
This functionality is used to select all the charts in Dashboard page. (Figure 3)

Figure 3
Uncheck All:
This functionality is used to uncheck the selected charts. (Figure 4)

Figure 4
Export to Word:
This functionality is used to export the selected chart to MS Word.
Steps:
- Cost Analysis —> Dashboard
- Select the chart using the provided checkbox in the corner of each chart. (Figure 1)
- Click the Word icon to export the chart to MS Word. (Figure 5)

Figure 5
Export Iteration Data:
This functionality is used to export the iteration data along with task details to MS Excel.
Steps:
- Cost Analysis —> Dashboard
- Select the chart using the provided checkbox in the corner of each chart. (Figure 1)
- Click the Word icon to export the chart to MS Word. (Figure 6)

Figure 6
Export to Excel:
This functionality is used to export the selected chart to MS Excel.
Steps:
- Cost Analysis –> Dashboard
- Select the chart using the provided checkbox in the corner of each chart. (Figure 1)
- Click the Excel icon to export the chart to MS Excel. (Figure 7)

Figure 7
Export to Power Point:
This functionality is used to export the selected chart to MS Power Point.
Steps:
- Cost Analysis —> Dashboard
- Select the chart using the provided checkbox in the corner of each chart. (Figure 1)
- Click the Power Point icon to export the chart to MS Power Point. (Figure 8)

Figure 8
Download as zip file:
This functionality allows you to download the selected reports as zip. (Figure 9)
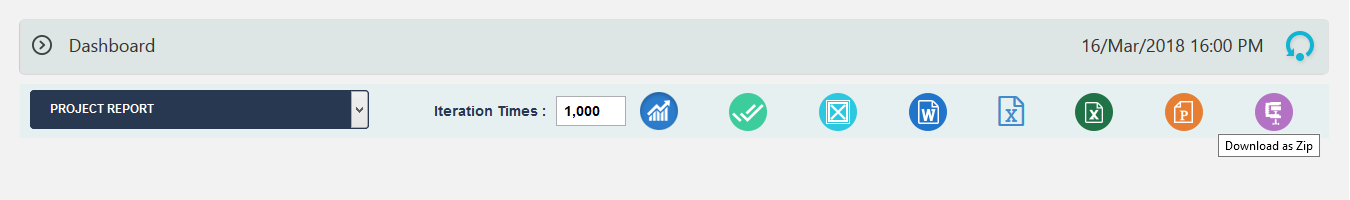
Figure 9