The Project Dashboard page shows the 14 fixed graphs of the selected project, the Duration with Risk Events, Duration Without Risk Events, Delta of Cumulatives (Duration), Start Date With Risk Events, Start Date Without Risk Events, Delta of Cumulatives (Start), Finish Date With Risk Events, Finish Date Without Risk Events, Delta of Cumulatives (Finish), Duration Values With Risk Events Isolated To P, Duration Percentages With Risk Events Isolated To P, Duration Values Without Risk Events Isolated To P, Duration Percentages Without Risk Events Isolated To P and Input Count. The Dashboard page is visible to only those users with Read/Write or View access.
To get individual tasks reports of the above, select the particular task from the PROJECT REPORT dropdown.
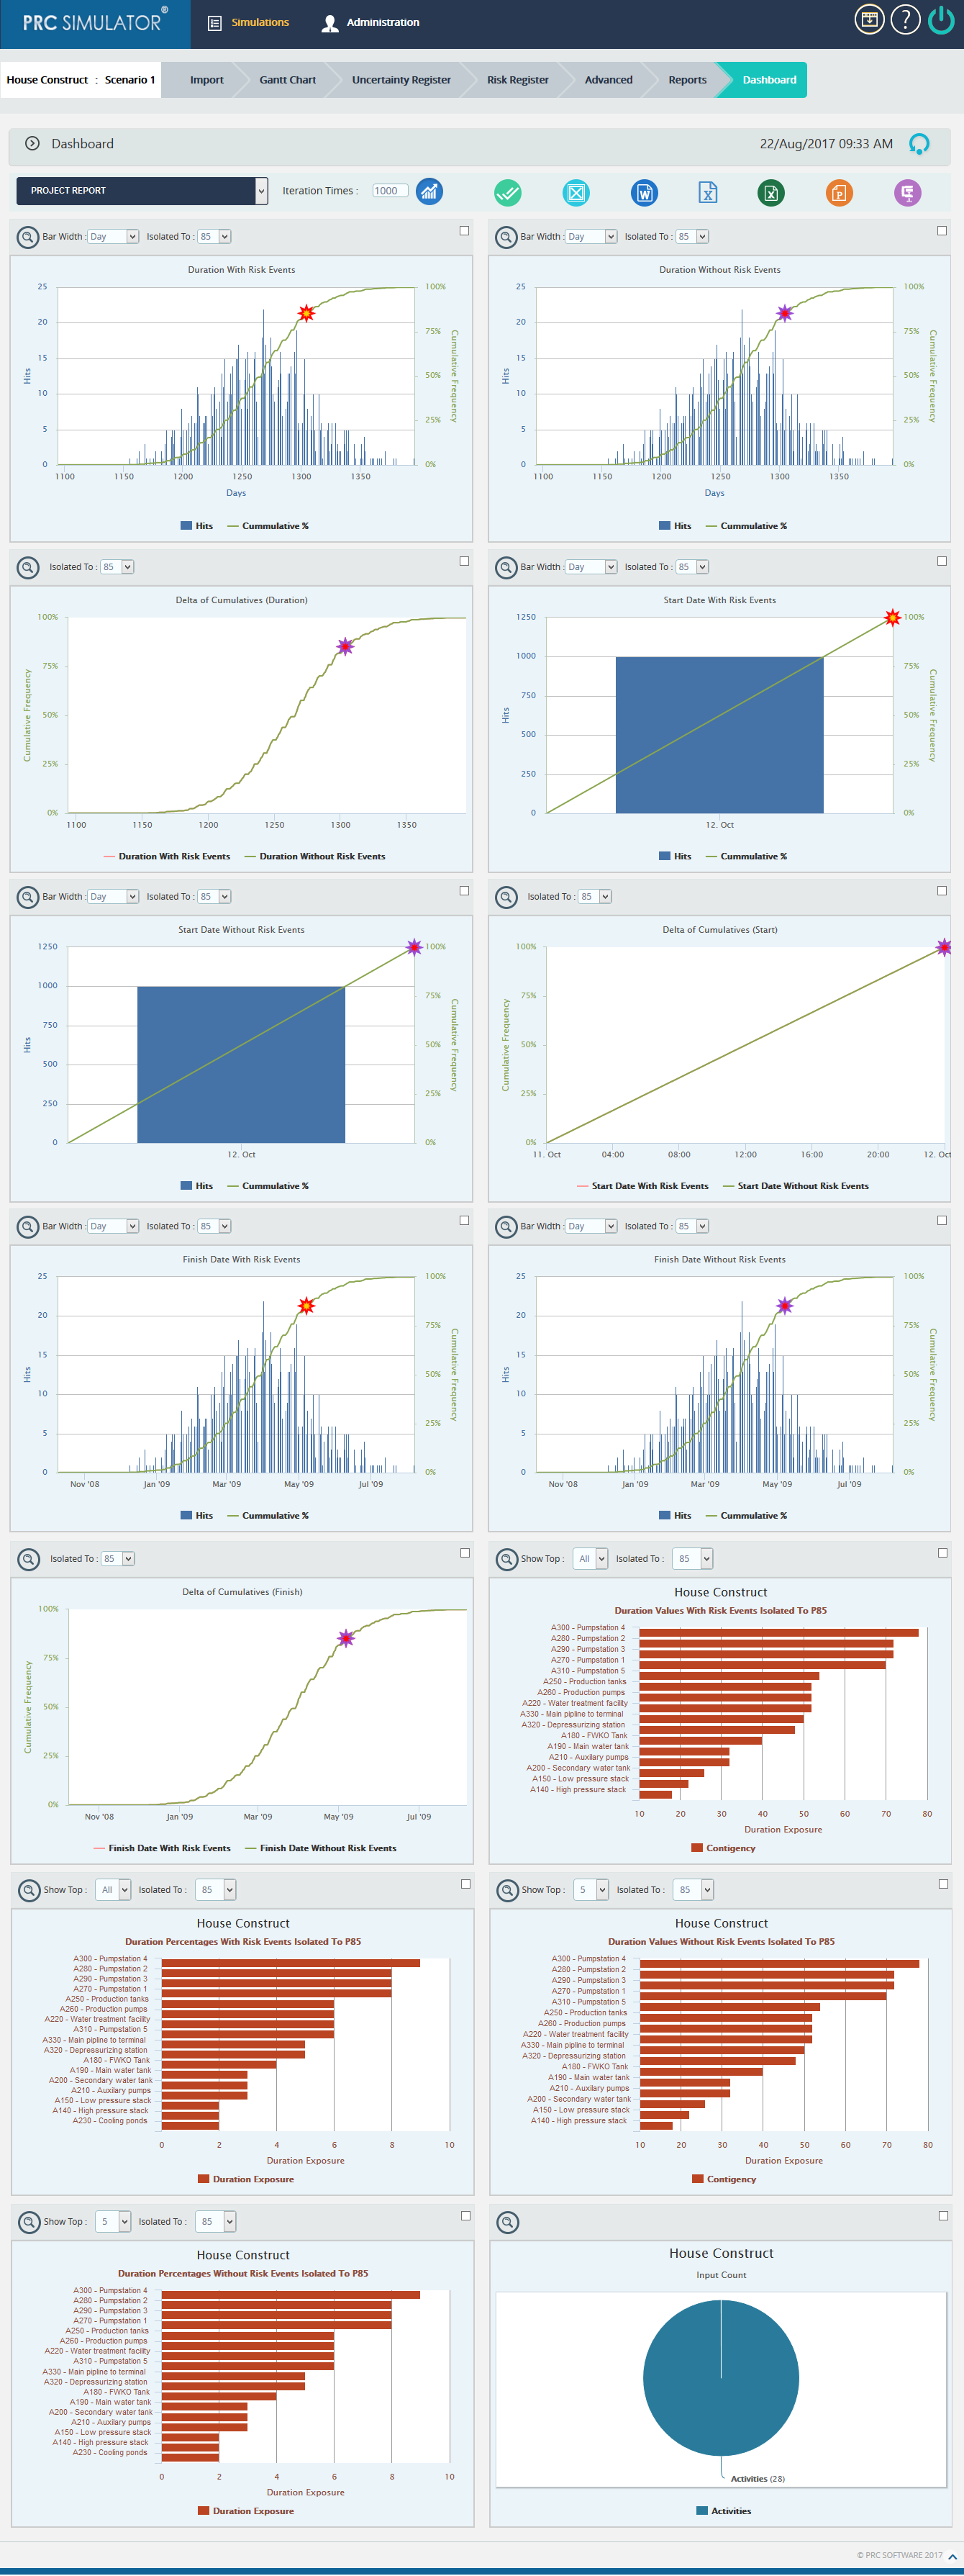
Figure 1
2.7.1 Run Analysis:
This functionality is used to generate the charts based on the given number of iterations.
Steps:
- Simulations –>Dashboard
- Input the number of iterations
- Click RUN ANALYSIS icon to generate the simulation reports. (Figure 1)
2.7.2 Export to Word:
This functionality is used to export the selected chart to MS Word.
Steps:
- Simulations —> Dashboard
- Select the chart using the provided checkbox in the corner of each chart. (Figure 1)
- Click the Word icon to export the chart to MS Word. (Figure 1)
2.7.3 Export to Power Point:
This functionality is used to export the selected chart to MS Power Point.
Steps:
- Simulations —> Dashboard
- Select the chart using the provided checkbox in the corner of each chart. (Figure 1)
- Click the Power point icon to export the chart to MS Power Point. (Figure 1)
2.7.4 Export to Excel:
This functionality is used to export the selected chart to MS Excel.
Steps:
- Simulations –> Dashboard
- Select the chart using the provided checkbox in the corner of each chart. (Figure 1)
- Click the Excel icon to export the chart to MS Excel. (Figure 1)
2.7.5 Compress Files:
This functionality is used to compress the selected images to a Zip file.
Steps:
- Simulations —> Dashboard
- Select the chart using the provided checkbox in the corner of each chart. (Figure 1)
- Click the Compress Files (Figure 1)
2.7.6 Check All:
This functionality is used to select all the charts in Dashboard page. (Figure 1)
2.7.7 Uncheck All:
This functionality is used to uncheck the selected charts. (Figure 1)
2.7.8 Drill Down:
This functionality allows you to redirect to the particular report in Reports page. (Figure 1)
2.7.9 Export Iteration Data:
This functionality is used to export the iteration data along with task details to MS Excel. (Figure 1)
2.7.10 Add Dashboard::
This functionality is used to add dashboard of mile stone tasks reports to the Project Report Dashboard list.
Steps:
- Simulations —> Dashboard
- Click the Add Dashboard(Figure 1)A pop up appears as in Figure 2
- Select the milestones whose dashboard has to created with the individual task reports using the provided checkbox and Click the SAVE button. (Figure 2)
- Select the Dashboard added from the Project Report dashboard drop down (Figure 3), it displays reports related to milestones.

Figure 2

Figure 3