The Portfolio Dashboard page shows 4 fixed charts: Risk Score Tornado (Threats), Risk Score Tornado (Opportunities), Mitigation Past Due, and Qualitative Inputs-Cost Exposure(Threats). The data shown is from projects across multiple Business Units based on the user´s access level. The Portfolio Dashboard is useful because the user can quickly view the charts most commonly used at the portfolio level. The Portfolio Dashboard page is visible to only those users with Read/Write or View access.

Figure 1
Select Dashboard Dropdown:
This functionality is used to navigate to the Manager’s Dashboard (Portfolio) page. The dropdown shown in Figure 1 contains dashboard names. Each dashboard name generates the dashboard associated in the Manager’s Dashboard (Portfolio) page.
Steps:
- Portfolio Management —> Portfolio Dashboards
- Select the dashboard name from the dropdown. (Figure 1)
Export to Word:
This functionality is used to Export the selected chart to MS Word.
Steps:
- Portfolio Management —> Portfolio Dashboards
- Select the chart using the provided checkbox in the corner of each chart. (Figure 1)
- Click the Open in Word icon to Export the chart to MS Word. (Figure 1)
Export to PowerPoint:
This functionality is used to Export the selected chart to MS Power Point.
Steps:
- Portfolio Management —> Portfolio Dashboards
- Select the chart using the provided checkbox in the corner of each chart. (Figure 1)
- Click the PowerPoint icon to Export the chart to MS Power Point. (Figure 1)
Compress Files:
This functionality is used to compress the selected images to a Zip file.
Steps:
- Portfolio Management —> Portfolio Dashboards
- Select the chart using the provided checkbox in the corner of each chart. (Figure 1)
- Click the Compress Files icon. (Figure 1)
Check All:
This functionality is used to select all the charts in Portfolio Dashboard page. Click the Check All icon to select all the charts. (Figure 1)
Uncheck All:
This functionality is used to uncheck the selected charts. Click the Uncheck All icon to uncheck the charts selected. (Figure 1)
Refresh:
This functionality is used to refresh the chart with the most recent data from the project database. To refresh the chart, click the Refresh icon. (Figure 1)
Set as default:
This functionality is used to make the selected dashboard as the default dashboard. (Figure 1)
Drill Down:
This functionality allows you to redirect to the particular report page in Standard Reports (Portfolio) from where the chart is added. To redirect a chart click Drill Down icon. (Figure 1)
Copy to Dashboard:
This functionality allows you to copy the particular chart to another dashboard. Click the Copy to Dashboard icon.
Steps:
-
-
Portfolio Management —>Dashboards —>Manager´s Dashboard.
-
Click the Copy to Dashboard icon. (Figure 1)
-
A pop up appears (Figure 2). Select the name of the dashboard from the Name dropdown, to which the chart has to be copied.
-
Click SAVE button. (Figure 2)
-
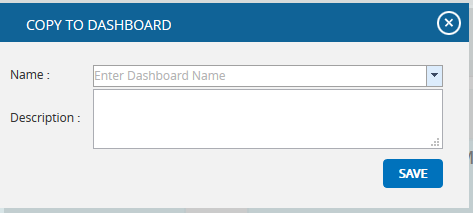
Figure 2