Risk inputs section shows all the tasks details that are imported through the Import page. Risk inputs are useful to get the task details in a table view.
This section allows the users to edit the task values for those who have the Read/Write access to the page.

Figure 1
2.2.1 Show Column Order:
This functionality helps the user to rearrange the risk input columns.
Steps:
- Simulations –> Gantt chart
- Click the SHOW COLUMN ORDER (Figure 1) The default column order appears as in Figure 2.
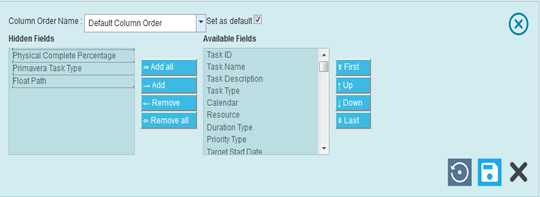
Figure 2
The functionality consists of two lists, Available Fields and Hidden Fields. Available Fields (Figure 2) contains all the columns added in the risk inputs. Hidden Fields (Figure 2) displays the fields that are removed from the Available Fields. A field can be added to the Available Fields list using the Add button. All fields under the Hidden Fields list can be moved to the Available Fields list using the Add All button.
A single field from the Available Fields list can be moved to the Hidden Fields list using the Remove button. If the Available Fields list contains more than one field and the user needs to move them all to the Hidden Fields list, they can use Remove All button.
The fields in the Available Fields can be rearranged by selecting the field and clicking the First, Up, Down or Last button accordingly. (Figure 2)
Users with Read/Write access can enter a new Column Order Name and set that order as default by checking the Set as default option (Figure 3). Only a single order from the list will be set as default at a time.
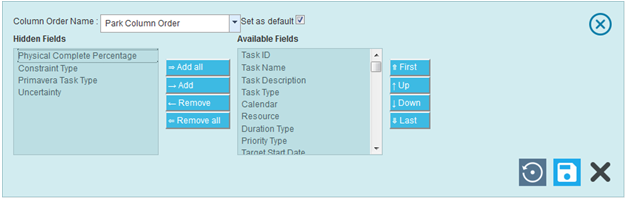
Figure 3
2.2.1.1 Reset Column Order:
This functionality cancels the change done and resets the pre defined column order. (Figure 4)
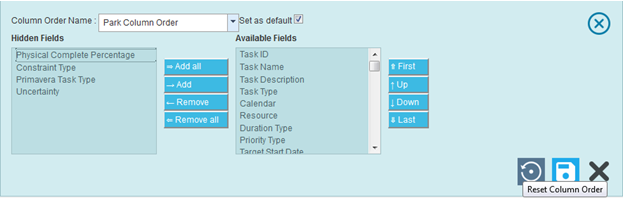
Figure 4
2.2.1.2 Save Column Order:
This functionality is used to save the newly entered Column Order Name to the list with the field changes made. (Figure 5)
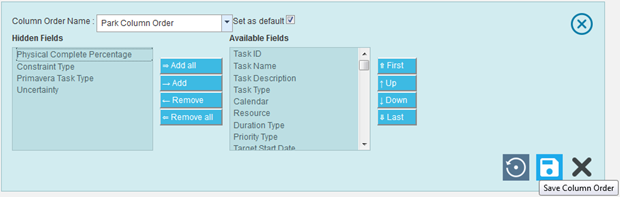
Figure 5
2.2.1.3 Delete Column Order:
Any new column order other than the default one can be deleted. (Figure 6)
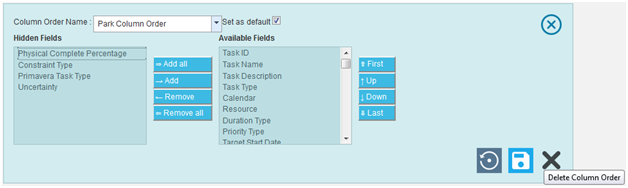
Figure 6
2.2.2 Export to XLS:
This functionality is used for exporting the risk inputs to a .XLS file.
2.2.3 Import from XLS:
This functionality is used for importing the risk inputs from a .XLS file.
Steps:
- Simulations –> Gantt chart
- Click on the IMPORT FROM XLS (Figure 1)
- Browse the file to be imported and upload. (Figure 7)
- Map the corresponding Values in Database to the Value in Excel and click on the IMPORT VALUES (Figure 7).

Figure 7
2.2.4 Filter By:
This functionality is used to filter the data according to a particular field and its selected values for risk / task.
Steps:
- Simulations –> Gantt chart
- Select the required column from the Filter by dropdown. (Figure 1)
- Enter the value in the textbox provided or select a value from the drop down based on which filtering is to be done. (Figure 8) While giving conditions with `select multiple´ option to filter, a pop up appears (Figure 9) where the multiple risks can be selected.
- Click the filter icon (Figure 8). The filtered data will be displayed.
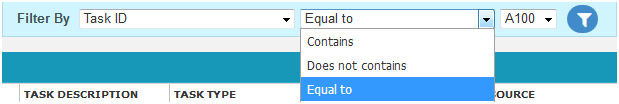
Figure 8
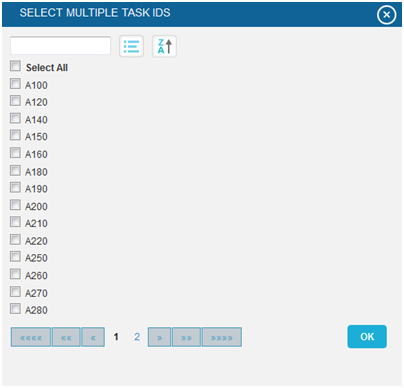
Figure 9