The Manager’s Dashboard (Portfolio) page shows up to 6 charts chosen by the user. The charts shown on this page must be created on the Standard Reports page. The Manager’s Dashboard gives the user the ability to quickly view the critical project information and export them to MS Word and MS PowerPoint.

Figure 1
Select Dashboard Dropdown:
This functionality is used to show the corresponding dashboard selected. The dropdown shown in Figure 1 contains dashboard names. Each dashboard name generates the dashboard associated with it.
Steps:
- Portfolio Management —>Dashboards —>Manager´s Dashboard
- Select the dashboard name from the dropdown. (Figure 1)
To navigate to Portfolio Dashboard:
Steps:
- Portfolio Management —>Dashboards —>Manager´s Dashboard
- Select the Portfolio Dashboard from the dropdown. (Figure 1)
Delete Dashboard:
This functionality is used to delete the corresponding dashboard selected from the dropdown.
Steps:
- Portfolio Management —>Dashboards —>Manager´s Dashboard
- Select the Dashboard Name from the Portfolio Dashboard dropdown. (Figure 1)
- Click the Delete button to delete the selected Dashboard. (Figure 1)
Export to Word:
This functionality is used to Export the selected chart to MS Word.
Steps:
- Portfolio Management —>Dashboards —>Manager´s Dashboard
- Select the chart using the provided checkbox in the corner of each chart. (Figure 1)
- Click the Open in Word icon to Export the chart to MS Word. (Figure 1)
Export to PowerPoint:
This functionality is used to Export the selected chart to MS PowerPoint.
Steps:
- Portfolio Management —>Dashboards —>Manager´s Dashboard
- Select the chart using the provided checkbox in the corner of each chart. (Figure 1)
- Click the PowerPoint icon to Export the chart to MS PowerPoint. (Figure 1)
Compress Files:
This functionality is used to compress the selected images to a Zip file.
Steps:
- Portfolio Management —>Dashboards —>Manager´s Dashboard
- Select the chart using the provided checkbox in the corner of each chart. (Figure 1)
- Click the Compress Files icon. (Figure 1)
Check All:
This functionality is used to select all the charts. Click the Check All icon to select all the charts. (Figure 1)
Uncheck All:
This functionality is used to uncheck the selected charts. Click the Uncheck All icon to uncheck the charts selected. (Figure 1)
Set as default:
This functionality is used to make the selected dashboard as the default dashboard. Click the Set as Default icon to set a dashboard as default. (Figure 1)
Refresh:
This functionality is used to refresh the chart with the most recent data from the project database. To refresh the chart, click the Refresh icon. (Figure 1)
Reposition Arrows:
This functionality allows the user to move the selected chart to another position on the page. To reposition a selected chart, click the Reposition arrows nearby. (Figure 1)
Filter:
This functionality allows the user to view the filter applied to the chart. To view filter applied click the Show Filter icon. (Figure 1) An example of the screen which appears after the icon is clicked is shown in Figure 2.

Figure 2
If the user changes the business unit on Manage Projects page for the projects in a particular chart which is already added on the dashboard in which filter is applied, then on clicking the Refresh button, those filters will be removed from the chart.
Delete From Dashboard:
This functionality allows you to delete a chart from the Manager´s Dashboard (Portfolio). To delete a chart, click the Delete icon above each chart. (Figure 1)
Drill Down:
This functionality allows you to redirect to the particular report page in the Standard Reports (Portfolio) from where the chart is added. To redirect a chart, click the Drill Down icon. (Figure 1)
Copy to Dashboard:
This functionality allows you to copy the particular chart to another dashboard. Click the Copy to Dashboard icon.
Steps:
-
-
Portfolio Management —>Dashboards —>Manager´s Dashboard.
-
Click the Copy to Dashboard icon. (Figure 1)
-
A pop up appears. (Figure 3) Select the name of the dashboard from the Name dropdown, to which the chart has to be copied.
-
Click SAVE button. (Figure 3)
-
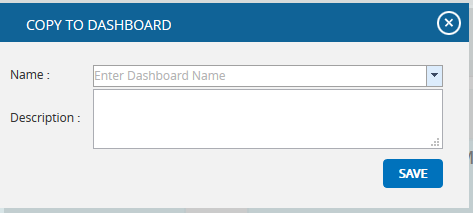
Figure 3
Share Dashboard:
This functionality allows you to share one dashboard chart to a new dashboard. Click the Share Dashboard icon.
Steps:
-
- Portfolio Management —>Dashboards —>Manager´s Dashboard.
- Click the Share Dashboard icon. (Figure 1)
- A pop up appears. (Figure 4) Give the name and description of the new dashboard to which the chart has to be shared. The Global Access option allows the user to share the dashboard globally.
- Click SAVE button. (Figure 4)
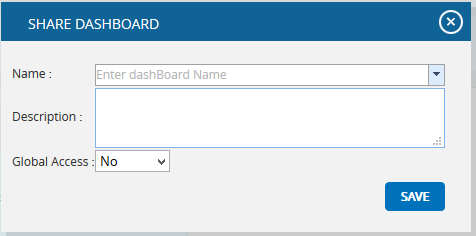
Figure 4